Unit 2 Online Study Guide
Learning Unit 2: Learning resources and the occupational learning materials and context
After completing this learning unit, you will be able to access, use and manage suitable learning resources; manage occupational learning materials; and reflect on how characteristics of the workplace and occupational context affect learning. You will be able to:
- Identify relevant learning resources
- Use learning resources effectively and manage it through appropriate selection and cross-referencing of information and acknowledgement of sources
- Organise and use occupational learning materials for optimum learning
- Understand and use layout, presentation and organisational features of learning materials effectively
- Engage technical language/terminology with and clarification sought if needed
- Identify the sector and organisation type
- Describe and discuss the workplace features
- Describe and discuss the ways in which these features affect learning processes and/or application of learning.
Learning resources and occupational learning materials and context
Throughout your learning, you will discover and use a variety of learning materials. Which training materials you use will depend partly on yourself and partly on the organisation or person who is facilitating (making possible) your learning. For example, you may be attending a course that includes a training manual; however, if you decide to add some further research on the internet, you will be using two types of learning materials.
2.1 Identify relevant learning resources
It is important to identify learning resources:
- Resource centres
- A wide range of media
- Internet
- Other people
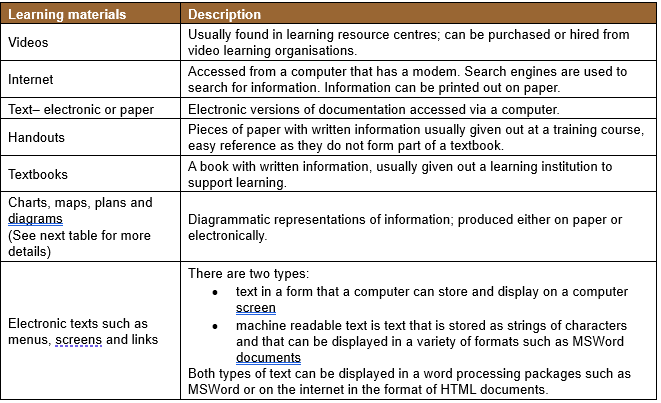
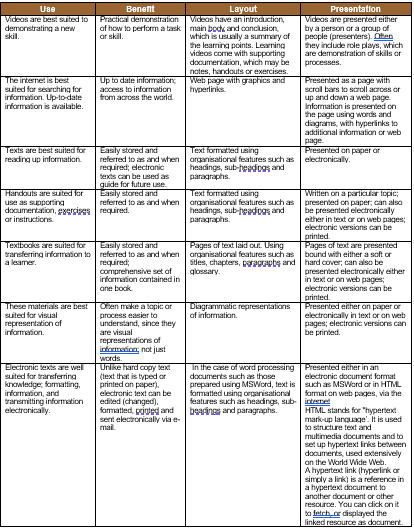
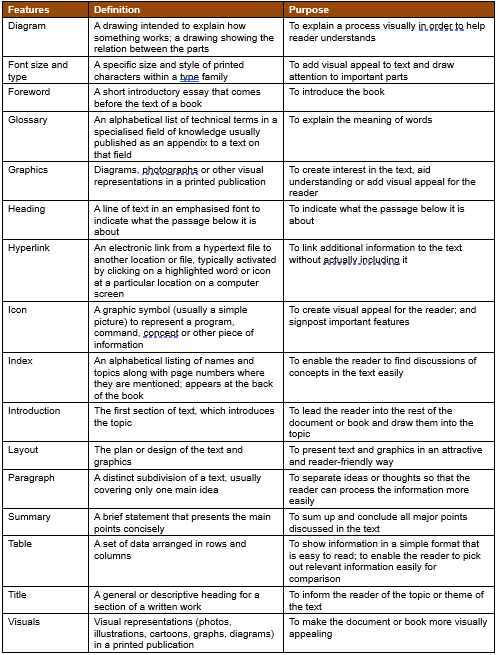
For each of the occupational learning materials we consider, we give a description and describe its use, benefits, and layout as well as how it is presented. We have brought all this information together in a table starting on the next page. Later we will look at organisational features and their benefits.
2.2 Use and manage learning resources
If you use resources in the ECD arena effectively and correctly, it may help you a lot to manage an ECD centre better. This is an ongoing exercise that needs to be updated according to new developments in technology and learning areas.
2.3 Manage language features and conventions for learning purposes
Good language skills result in effective communication skills. All young children arrive at your centre with a basic foundation in knowledge and learning that they acquired at home. Development and learning begins in the first language, and it is in this language that children begin to construct their knowledge and form meaningful communicative relationships. The various stages that we mention below will give a better picture into how important this skill is for effective development.
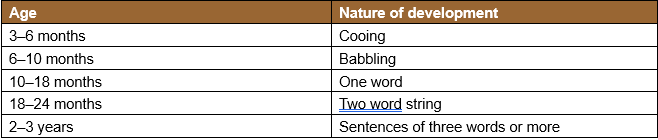
Stages of language development
The baby’s first word is an exciting event in a parent’s life. It is an important milestone that usually occurs around 10–18 months. The first words are usually verbs and nouns and often refer to the mother or father, toys, food, body parts, animals and household items. At around 13 months, a baby may string two words together in sequences that resemble sentences. Syntax, the set of rules for combining words, is learned during the early phases of this stage; this syntax, however, is very basic.
Comments/sentences that we may hear during this stage are:
- Cat go
- Me want
- Give mummy
From two word strings, the child moves on to more complicated sentences that, although they are not always grammatically correct, have very clear meaning. Examples:
- Daddy get toy
- I eat soup
- Lebo fall down
Knowledge of grammar and semantics (meaning of words and word endings and pre-fixes to form plurals and past tense) develops quickly as the child uses language to express mental processes.
By the third year, children may have acquired nearly 900 words in their vocabulary.
Young children are very competent talkers and often enjoy talking in front of groups. Sharing time gives children an opportunity to practise their speaking and listening. Some children are naturally talkative, others are quieter.
If you work with this age group, less confident children may need your help to come up with a "sharing" topic such as a new pet or a special outing. You will also come across children who talk about inappropriate things, such as private details of family life, or who try to outdo other children.
Also, remember that children at this age may have their own grammatical rules that are not easily changed, for example they might use gived for gave or mousses for mice. Do not correct these mistakes too much at this stage: the child may not pay attention to your efforts and you may inhibit them from speaking spontaneously.
Listening, speaking, reading or writing should be taught in a relevant and meaningful ways and should not be separated from the context in which the language is used.
Additional language acquisition: Home language first
The term "additional language†means an extra language that the child learns in addition to the main language that is spoken at home. Example:
If a child speaks isiZulu at home, but Sesotho at the ECD centre, the Sesotho is an additional language for the child. If a child speaks isiZulu at home, but during school holidays she/he visits grandparents in Mafikeng, then Setswana is an additional language for the child.
The process of acquiring an additional language is in many ways similar to the process of acquiring a main (first) language. This is because the same mental processes take place. When you acquire language, it is a subconscious process. You are so focused on getting the message across that you are not even aware that you are learning the language.
Language learning, on the other hand, is a conscious process during which you study new vocabulary, grammar and sentence construction.
It is a good idea to expose the child to a variety of familiar and unfamiliar language materials such as picture books, educational games, or flash cards with words.
Simple repetition does not necessarily help the child to acquire an additional language; however, it is essential to use and hear the language in context.
Language is acquired as a whole – not part by part. It is multi-sensory learning process that involves both the left and the right hemispheres (halves) of the brain.
The starting point for acquiring new concepts should be in the main language, or home language.
Once the child is confident in the home or main language, then learning and understanding an additional language will not be a problem.
As an ECD practitioner, you should arrange activities such as singing or reading poems and stories in the children’s main language as far as possible.
2.4 Organise and use occupational learning materials
Learning aids in a classroom and ECD centre are key tools to help children to develop optimally. The occupational learning materials could include:
- Videos
- Internet
- Texts
- Hand outs
- Text books
- Charts
- Maps
- Plans
- Diagrams
- Electronic texts (menus, screens, links, etc)
If these tools are organised and used effectively, it will help to ensure that the ECD programme is valuable to the practitioner.
Charts
A chart is a graphical representation of data. We often use charts to make large quantities of data easier for readers to understand at first glance.
Charts can represent data in several ways. Some of the different methods are listed below. The way a chart represents data depends on the type of data that is presented. For example, a customer satisfaction response may be measured in percentages – the percentage of customers satisfied, not satisfied, and unsure. In this instance, a pie chart may be most appropriate. A pie chart is visually attractive and makes it easy to compare data: the number of "satisfied' responses can be easily compared to the number of "dissatisfied" responses by simply comparing the size of each sector.
Let’s look at five different types of chart, namely:
- Bar chart
- Pie chart
- Histogram
- Flowchart
- Gantt chart
- Bar chart
A bar chart is a chart with rectangular bars. The length of each bar is normally in proportion to the size of the value it presents. If the scale on the chart doesn’t start at zero, the bars are not proportional. In some cases, starting at zero will not show the differences between the bars clearly, so we rather focus on the relevant range of values.
- Pie charts
A pie chart is a circular chart that is divided into segments, and that illustrates relative sizes or frequencies. In a pie chart, the area of each segment is proportional to the quantity it represents. Together the wedges create a full disk. A chart with one or more wedges separated from the rest of the disk is called an exploded pie chart.
- Histogram
A histogram is similar to a bar chart and is used to display statistics. So a histogram is the graphical version of a table that shows what proportion of cases fall into each category. The categories are usually neighbouring intervals of some variable, for example the months of the year or increasing amounts.
As an example, look at the figures in the table below, which are adapted from data collected during a census. About 105 000 people were asked how long it took them to get to work, and their responses were divided into categories: less than five minutes, five to ten minutes, and so on. (Column 4 gives the same figures as column 3, but here they are expressed as a percentage and rounded off.)
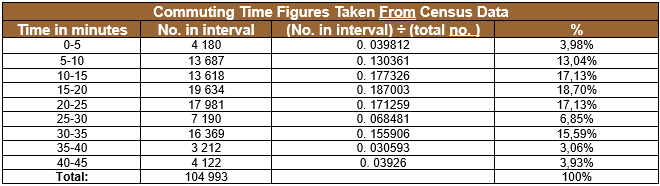
In the histogram figure below that shows travelled time, the area of each bar is equal to the total number of people in that category. So the total area of all bars is equal to the total number of people in the survey (104 993) (We plotted the figures in columns 1 and 2)
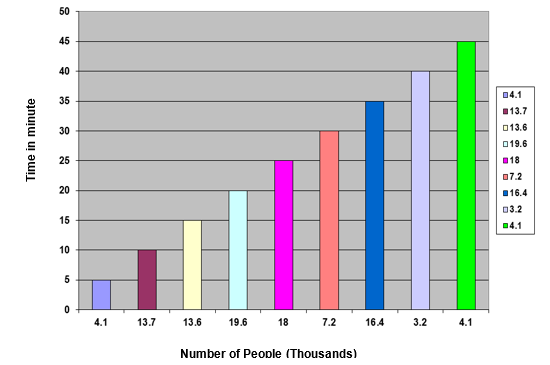
An interesting feature of this histogram is the spike (sudden rise) in the 30 to 35 minutes category. This is probably just because half an hour is a common unit of informal time measurement, so people who travelled for times that were perhaps a little less than or a little greater than 30 minutes might answer “30 minutesâ€.
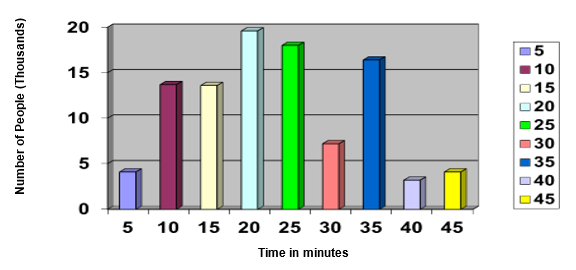
Now let’s show the same data in a slightly different way. In the figure below, the area of each bar is equal to the proportion of all the people in the survey who fall into that category.
So the total of all the bars is equal to 1, or 100%. (Here we plotted the figures in columns 1 and 4 of the first table.)
This figure differs from the previous figure only in the vertical scale. The purpose of the histogram will determine which form one uses. If the absolute numbers are important, then the first form is more useful. The second form is more useful if proportions are important.
- Flowchart
A flowchart (also spelled flow-chart or flow chart) is a schematic representation of a process. Flowcharts are commonly used in business or economic presentations to give the audience an overview of a process or to find flaws and bottlenecks.
Flowcharts may be used to show e. g. instructions for assembling a bicycle, an attorney’s timeline for a court case, a diagram in the work flow in a vehicle manufacturing plant, and the decisions you have to take when doing a tax calculation.
- Gantt chart
A Gantt chart is a popular type of bar chart that shows how projects, schedules, and other time-related systems progress over time. In project management, a Gantt chart shows how various parts of a project are interrelated and how each part is progressing.
- Maps
A map is a two-dimensional representation of a three-dimensional space. Most maps give a scale, which indicates the relationship between the distances on the map or model and the corresponding distances in reality or the original. For example, a map of scale 1: 50 000 shows a distance of 50 000 cm (=500 m) as 1 cm on a map, in other words a kilometre is shown as 2 cm. if an architect designs a building that is to be 30 m in height, and builds a model of it on the scale of 1: 25, the model will be 1. 2 m high.
- Plans
A plan prescribes proposed methods of how to move towards, or achieving one or more objectives, such as when completing a project or running a business.
There are many types of plans. Let’s look at business plans and marketing plans in more detail.
A marketing plan is a written document that details the actions needed to achieve a specified marketing objective for a product or service. The marketing plan can cover one year (in which case it is an annual marketing plan), or up to five years. A marketing plan may be part of an overall business plan.
A business plan is a summary of how a business owner, manager, or entrepreneur plans to organise a commercial venture and implement the actions required for it to succeed. It is a written explanation of the company’s business model.
Business plans are used internally (inside the organisation) for management and planning. They are also used to convince outsiders such as banks or investors to invest money in the venture. In general, a business plan must:
- Describe and explain the current situation
- Specify the expected results (objectives)
- Identify the resources that will be needed (including financing, time and skills)
- Describe the actions that will need to be taken to achieve the objectives
- Describe a method of monitoring results and adjusting the plan where necessary.
There are many formats for marketing and business plans, and every company does it a little differently. The example outline below is a very comprehensive format for a 30- to 40-page business plan. The sections would be as follows:
- Title page
- Executive summary
- Current situation
- Competition and market share
- Current situation – Consumer analysis
- Current situation – Internal
- Summary of situation analysis
- Marketing strategy
- Financial summary
- Appendix
- Diagrams
A diagram is a simplified and structured visual representation of concepts and ideas. Diagrams of networks are some of the common types of diagrams you may have come across.
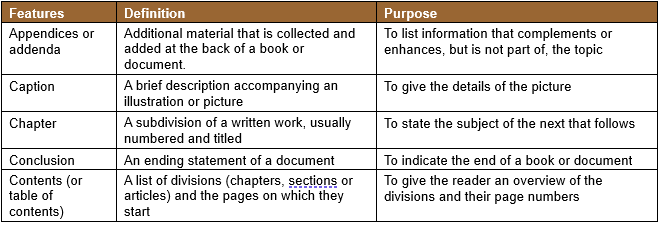
2.5 Understand and use layout, presentation and organisational features of learning materials
Organisational layout features are parts of text (like heading and spacing) that help to organise the text to make it the attractive, more reader friendly and easier to explain what they are used for.
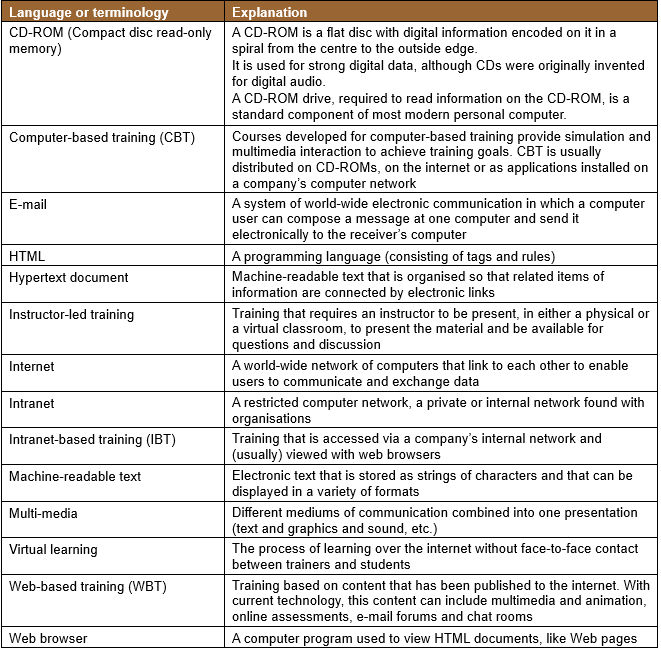
2.6 Engage with technical language/terminology
As an ECD practitioner, you need to be aware of the constant changing world of technology that can help you to be successful in your career. You are well aware that development does not stop when you become an adult. Learn, engage (get involved), ask and empower yourself continuously within the learning environment.
The table below presents some of the more commonly used terms that relate to online and learning environments.
How
to find help with technical language and terminology
What can
you do if you hear or read technical language or terminology that you do not understand?
Here are some ways in which you can seek clarity.
If you don’t have internet access
Look up
the meaning in a dictionary or visit your local library and find books on the
subject.
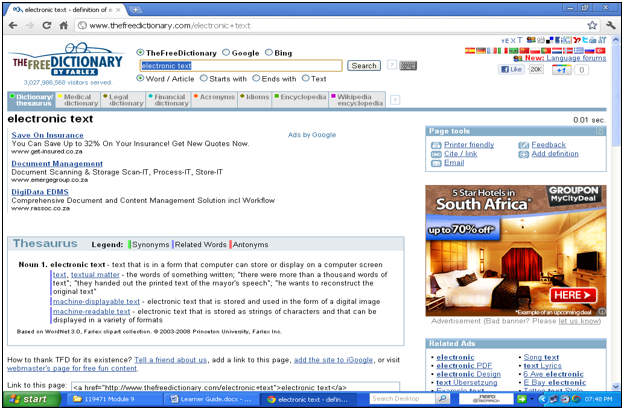
If you have internet access
Use an internet
dictionary to search for a definition or meaning of the word or phrase. You can
find an excellent internet dictionary on the website:
http: //encyclopaedia. thefreedictionary.
com.
Here are the steps to follow to search for a word:
- Log on the internet and go to the website: http: //encyclopedia. thefreedictionary. com.
- Type in the word on which you seek clarification in the word search box as shown below:
2.7 Reflect on the characteristics
of the workplace and occupational context affecting learning
It is important to be able to reflect on (ponder, think about) how the following characteristics of the workplace and occupational context affect learning, e. g.:
- Environmental features
- Technological resources
- Communication resources
- Communication strategies
- Multilingual needs in relation to client or colleague interaction
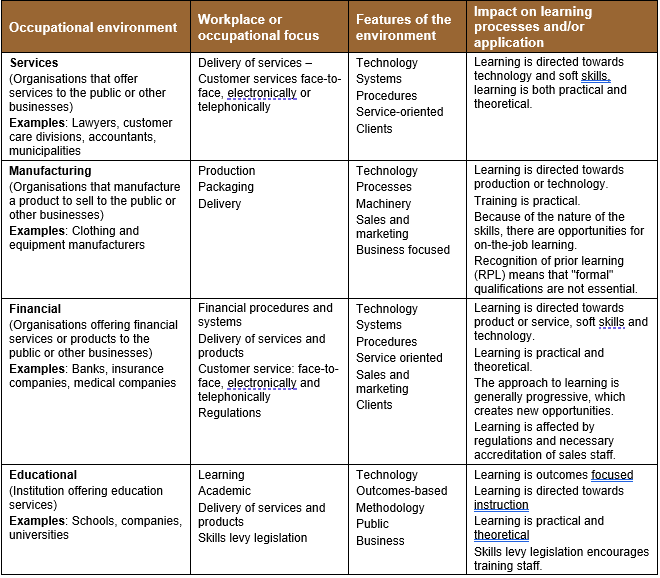
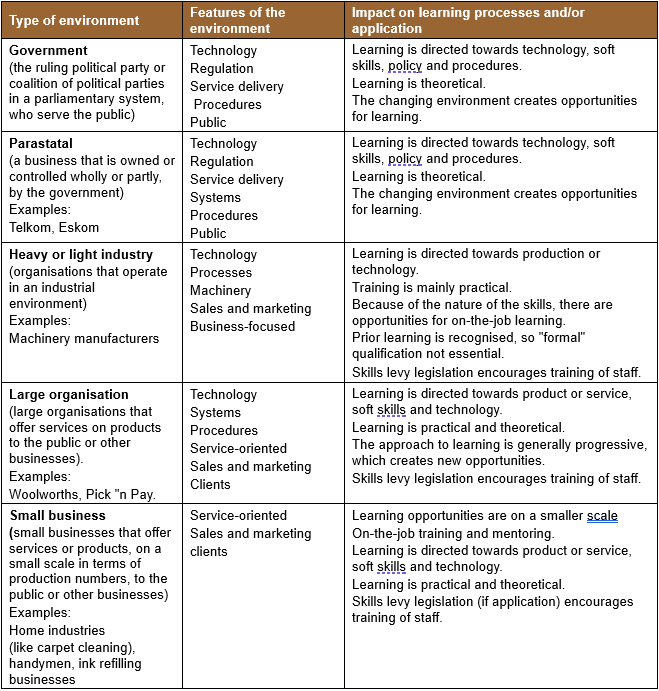
The table below looks at each type of business in turn – features of workplaces and their impact on learning. In column 2 you can see what products or services each type focuses on. Column 3 summarises the features of the particular environment and column 4 looks at how these features affect the learning processes needed in that workplace. The skills levy legislation referred to in the next two tables is:
- The Skills Development Act No. 97 of 1998
- The Skills Development Regulations2001
- The related Guidelines
2.8 Identify the sector and organisation type
Organisations are made of various groups of people who are using their particular industry skills and resources for a service or manufactured products. The various types are listed and explained below:
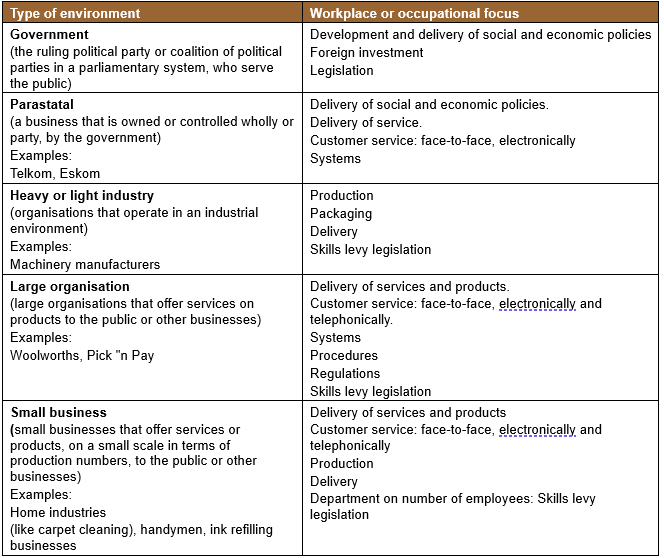
2.9 Describe and discuss the workplace features and the ways in which these features affect learning processes and/or application of learning
If you work within a particular type of organisational arena will build upon certain skills that are only found within that sector. Some of the skills can be used across various sectors. In the table below we show how these are inter-related and how they are applied in the various types of environment.
Conclusion
- Learning can be defined formally as the act, process, or experience of gaining knowledge or skills. In contrast, memory can be defined as the capacity of storing, retrieving, and acting on that knowledge
- Learning helps us to change from beginners to experts and enables us to gain new knowledge and abilities
- Learning strengthens the brain by building new nerve pathways and increasing connections that we can use when we want to learn more, (More complex definitions of learning include references to comprehension and mastery through experience or study.)
- Learning is important because no one is born with the ability to function competently as an adult in society. Amazingly enough, people can learn from the moment of birth
- Learning can and should be a lifelong process and is certainly not limited to school, company or university activities
- We constantly try to make sense of our experiences and keep searching for information, knowledge and meaning. In essence, we continue to learn.
In order to learn effectively and successfully in the workplace, we need to:
- Access, use and manage suitable learning resources
- Formulate and use learning strategies
- Manage occupational learning materials
- Lead and function in a team
- Understand how characteristics of the workplace and occupational context affect learning.
In today’s business environment, organisations that can find better ways for their staff to learn, will get ahead. Strong minds fuel strong organisations. Companies must make the most of the natural learning styles of their people and then build systems to satisfy those needs.
Education is a companion which no misfortune can depress; no crime can destroy, no
Enemy can alienate, no repression can enslaveJoseph Addison (1672-1719)